
Matplotlib offers robust text support for creating and customizing text in plots, offering flexibility and control over various text properties. It includes features like writing mathematical expressions, font customization, newline-separated text with arbitrary rotations, and Unicode support.
Vista Academy ensures that students master consistency in outputs, as Matplotlib embeds fonts directly into documents, preserving appearance across screen and print.
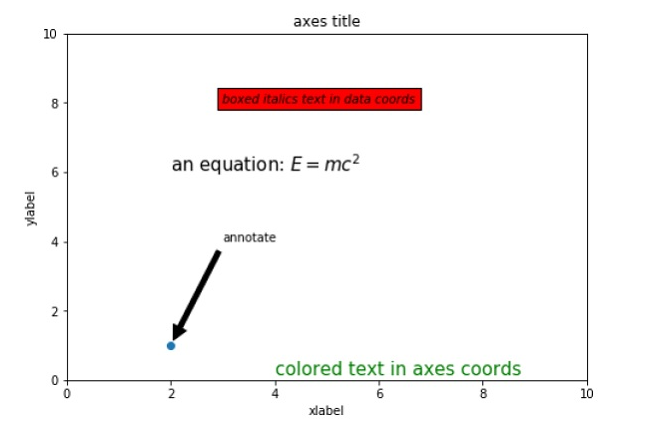
text, annotate, xlabel, ylabel, title, figtext, and suptitle.set_title, set_xlabel, set_ylabel.
All functions return a Text instance that can be customized with various properties.
Use suptitle() for the figure and set_title() for subplot (axes) titles.
import matplotlib.pyplot as plt
import numpy as np

# Generate data
x_values = np.linspace(0.0, 5.0, 100)
y_values = np.cos(2 * np.pi * x_values) * np.exp(-x_values)

# Create a plot
fig, ax = plt.subplots(figsize=(7, 4))
fig.subplots_adjust(bottom=0.15, left=0.2)
ax.plot(x_values, y_values)

# Add titles to the figure and axes
fig.suptitle('Figure Suptitle', fontsize=14, fontweight='bold')
ax.set_title('Axes Title')

# Display the plot
plt.show()
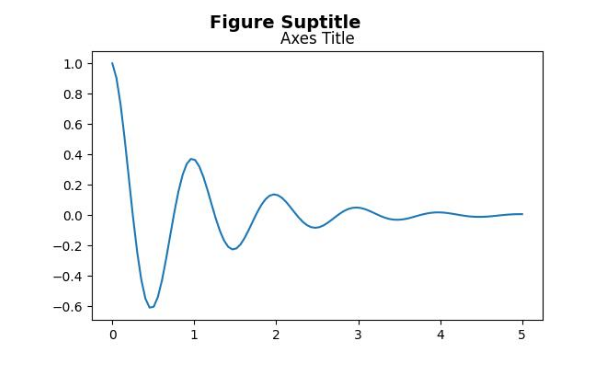
Text is added successfully to the figure and subplot.
Label your axes using xlabel and ylabel or their explicit versions set_xlabel and set_ylabel.
import matplotlib.pyplot as plt
import numpy as np

# Generate data
x_values = np.linspace(0.0, 5.0, 100)
y_values = np.cos(2 * np.pi * x_values) * np.exp(-x_values)

# Create a plot
fig, ax = plt.subplots(figsize=(7, 4))
fig.subplots_adjust(bottom=0.15, left=0.2)
ax.plot(x_values, y_values)

# Add labels to the x-axis and y-axis
ax.set_xlabel('X-Axis Label')
ax.set_ylabel('Y-Axis Label')

# Display the plot
plt.show()
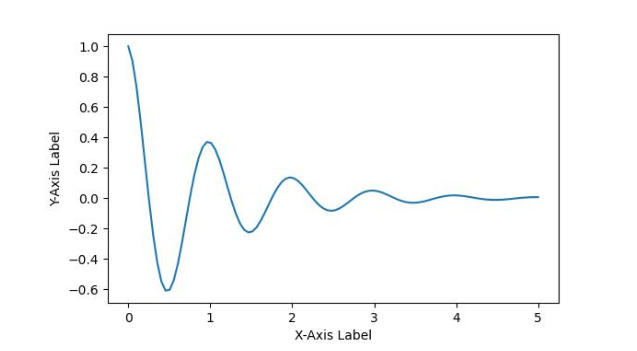
Labels added successfully to the x-axis and y-axis.
Add LaTeX-style math or Unicode text anywhere in your plot using the text() function.
import matplotlib.pyplot as plt

# Create a subplot
fig, ax = plt.subplots(figsize=(7, 4))
fig.subplots_adjust(top=0.85)

# Set the figure suptitle
fig.suptitle('Exploring Mathematical Expressions and Unicode Text')

# Set both x- and y-axis limits
ax.axis([0, 10, 0, 10])

# Add text with mathematical expression
ax.text(1.5, 7, "Einstein's energy-mass equivalence equation: $E=mc^2$",
        bbox={'facecolor': 'red', 'alpha': 0.5, 'pad': 10},
        style='italic')

# Add Unicode text
ax.text(3, 5, 'Unicode: pTHn', color='green', fontsize=15)

# Display the plot
plt.show()
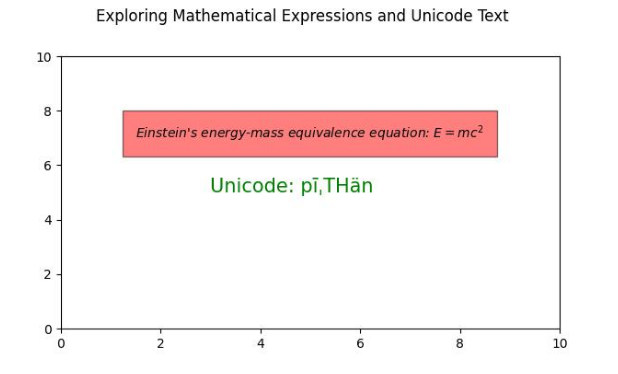
Successfully created a plot with Mathematical expressions and Unicode Text.
Create dynamic animated text by updating content or properties over time using FuncAnimation.
from matplotlib import animation
import matplotlib.pyplot as plt

# Adjust figure size and autolayout
plt.rcParams["figure.figsize"] = [7.00, 3.50]
plt.rcParams["figure.autolayout"] = True

# Create figure and axes
fig = plt.figure()
ax = fig.add_subplot(111)

# Initial text
text = 'You are welcome!'
txt = ax.text(.20, .5, text, fontsize=15)

# Define colors for animation
colors = ['#1f77b4', '#ff7f0e', '#2ca02c', '#d62728',
          '#9467bd', '#8c564b', '#e377c2', '#7f7f7f',
          '#bcbd22', '#17becf']

# Define animation function
def animate(num):
    txt.set_fontsize(num * 2 + num)
    txt.set_color(colors[num % len(colors)])
    return txt,

# Create animation
anim = animation.FuncAnimation(fig, animate, frames=len(text) - 1, blit=True)

# Display animation
plt.show()
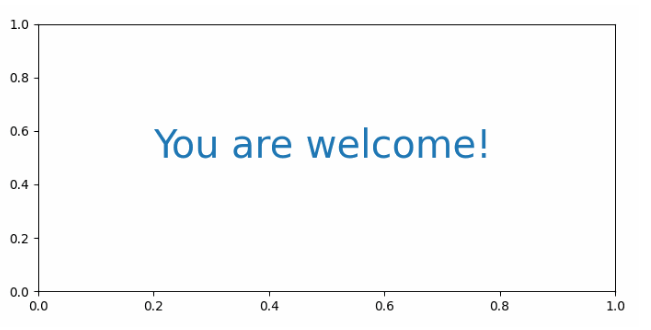
Animated text displayed successfully in the plot.