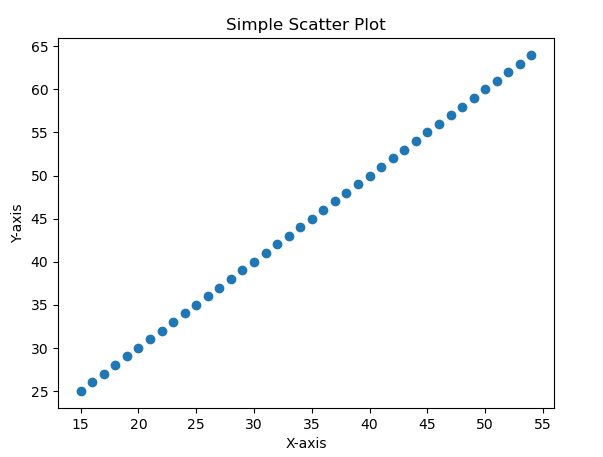
A simple plot in the Matplotlib library typically refers to the basic representation of data using graphical visualization. It’s often a line plot or scatter plot that displays relationships or trends in the data. This basic plot serves as a starting point for data exploration and visualization.
Simple plots are foundational in data analysis and visualization, providing initial insights into the dataset’s characteristics before creating more complex visualizations or performing deeper analysis.
The following are the key steps to create a simple plot:
This step involves preparing the data to be plotted. This could include numeric values, lists, arrays, or data loaded from files.
Using Matplotlib’s pyplot API or object-oriented interface, a simple plot is generated. Common functions include:
plot(): Creates line plots.scatter(): Generates scatter plots.bar(): Plots bar charts.hist(): Creates histograms.Customization includes adding labels, titles, adjusting colors, markers, axes limits, legends, and other attributes to enhance plot readability and aesthetics.
Finally, display the plot using show() in pyplot or other appropriate methods.
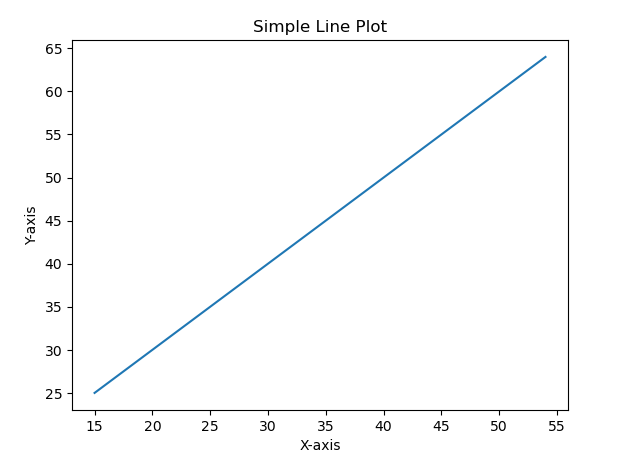
[Simple Line Plot Output]
[Simple Scatter Plot Output]