
Matplotlib and Seaborn are both powerful Python libraries used for data visualization but they have different strengths that are suited for different purposes.
Matplotlib is a comprehensive and widely used Python library for creating static, interactive and publication-quality visualizations. It provides a versatile toolkit for generating various types of plots and charts which makes it an essential tool for data scientists, researchers, engineers and analysts.
Matplotlib is the foundational library for plotting in Python. It provides low-level control over visualizations by allowing users to create a wide variety of plots from basic to highly customize.
It offers extensive customization options by allowing users to control every aspect of a plot. This level of control can sometimes result in more code for creating complex plots.
While it’s highly flexible, creating certain complex plots might require more effort and code compared to specialized libraries like Seaborn.
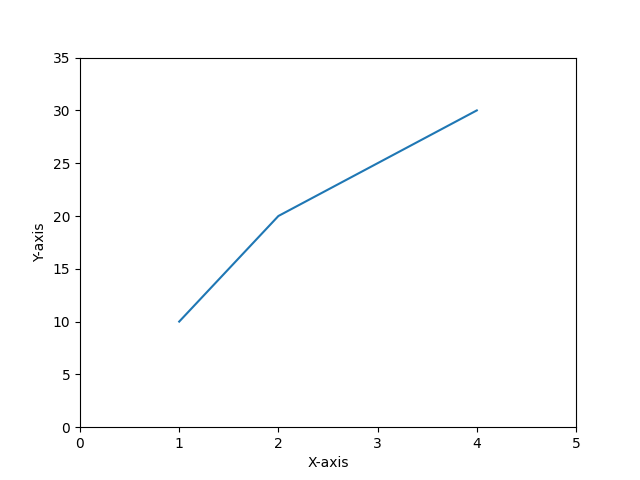
The following is the simple line plot created by using the Matplotlib library pyplot module.
Seaborn is a Python data visualization library that operates as an abstraction layer over Matplotlib. It’s designed to create visually appealing and informative statistical graphics, simplifying the process of generating complex visualizations from data.
Seaborn is built on top of Matplotlib and is particularly well-suited for statistical data visualization. It simplifies the process of creating complex plots by providing high-level abstractions.
Seaborn comes with attractive default styles and color palettes that make plots aesthetically pleasing with minimal effort.
It specializes in certain types of plots like violin plots, box plots, pair plots and more which are easier to create in Seaborn compared to Matplotlib.
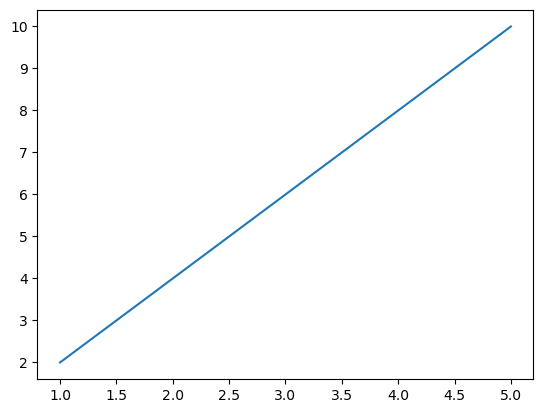
The following is the basic seaborn line plot.
| Matplotlib | Seaborn |
|---|---|
| Matplotlib is more low-level and requires more code for customizations. | Seaborn abstracts some complexities by enabling easier creation of complex statistical plots. |
| Matplotlib doesn’t have better default styles and color palettes when compared to seaborn. | Seaborn has better default styles and color palettes by making its plots visually appealing without much customization. |
| Matplotlib requires more effort to plot certain plots readily. | Seaborn offers certain types of plots that are not readily available or require more effort in Matplotlib. |
| Use when fine-grained control is needed or for non-standard plots. | Use when working with statistical data for quick exploration and visualization. |
Both libraries are valuable in their own way and sometimes they can be used together to combine the strengths of both for advanced visualization tasks.