
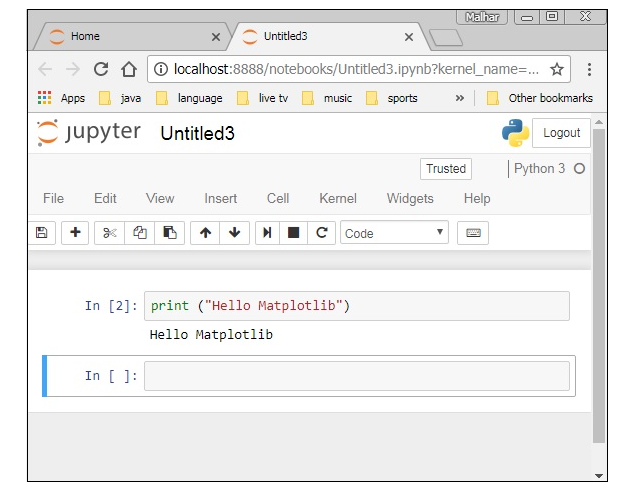
A new untitled notebook with the .ipynb extension (which stands for IPython Notebook) is displayed in a new browser tab once created.
matplotlib.pyplot is a collection of command-style functions that make Matplotlib work like MATLAB. Each function in the Pyplot API modifies a figure: it creates a figure, adds a plotting area, plots lines or shapes, and decorates the plot with labels, titles, etc.
| Sr.No | Function | Description |
|---|---|---|
| 1 | Bar | Make a bar plot. |
| 2 | Barh | Make a horizontal bar plot. |
| 3 | Boxplot | Make a box and whisker plot. |
| 4 | Hist | Plot a histogram. |
| 5 | hist2d | Make a 2D histogram plot. |
| 6 | Pie | Plot a pie chart. |
| 7 | Plot | Plot lines and/or markers to the Axes. |
| 8 | Polar | Make a polar plot. |
| 9 | Scatter | Make a scatter plot of x vs y. |
| 10 | Stackplot | Draws a stacked area plot. |
| 11 | Stem | Create a stem plot. |
| 12 | Step | Make a step plot. |
| 13 | Quiver | Plot a 2-D field of arrows. |
| Sr.No | Function | Description |
|---|---|---|
| 1 | Imread | Read an image from a file into an array. |
| 2 | Imsave | Save an array as an image file. |
| 3 | Imshow | Display an image on the axes. |
| Sr.No | Function | Description |
|---|---|---|
| 1 | Axes | Add axes to the figure. |
| 2 | Text | Add text to the axes. |
| 3 | Title | Set a title of the current axes. |
| 4 | Xlabel | Set the x-axis label of the current axis. |
| 5 | Xlim | Get or set the x-limits of the current axes. |
| 6 | Xscale | Set the scaling of the x-axis. |
| 7 | Xticks | Get or set the x-axis tick locations and labels. |
| 8 | Ylabel | Set the y-axis label of the current axis. |
| 9 | Ylim | Get or set the y-limits of the current axes. |
| 10 | Yscale | Set the scaling of the y-axis. |
| 11 | Yticks | Get or set the y-axis tick locations and labels. |
| Sr.No | Function | Description |
|---|---|---|
| 1 | Figtext | Add text to figure. |
| 2 | Figure | Creates a new figure. |
| 3 | Show | Display a figure. |
| 4 | Savefig | Save the current figure. |
| 5 | Close | Close a figure window. |