
Colormap (often called a color table or a palette), is a set of colors arranged in a specific order, used to visually represent data.
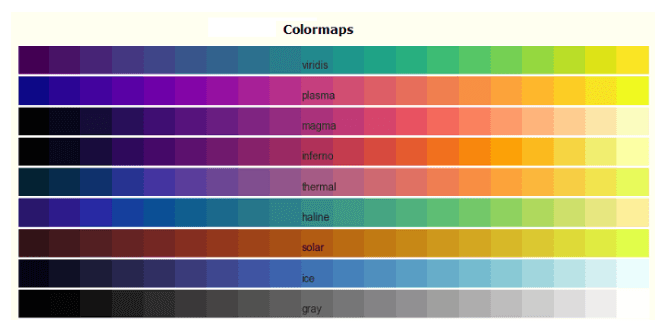
In Matplotlib, colormaps are essential for mapping numerical data to colors. You can access built-in colormaps and also create your own. Use matplotlib.colormaps to access the universal colormap registry.
from matplotlib import colormaps
print(list(colormaps))
This prints a complete list of all colormaps available in Matplotlib.
import matplotlib
viridis = matplotlib.colormaps['viridis'].resampled(8)
print(viridis(0.37))
Returns RGBA values from the viridis colormap.
import matplotlib as mpl
from matplotlib.colors import ListedColormap
import matplotlib.pyplot as plt
import numpy as np

colormaps = [ListedColormap(['rosybrown', 'gold', 'crimson', 'linen'])]
np.random.seed(19680801)
data = np.random.randn(30, 30)
n = len(colormaps)

fig, axs = plt.subplots(1, n, figsize=(7, 3), layout='constrained', squeeze=False)
for [ax, cmap] in zip(axs.flat, colormaps):
   psm = ax.pcolormesh(data, cmap=cmap, rasterized=True, vmin=-4, vmax=4)
   fig.colorbar(psm, ax=ax)
plt.show()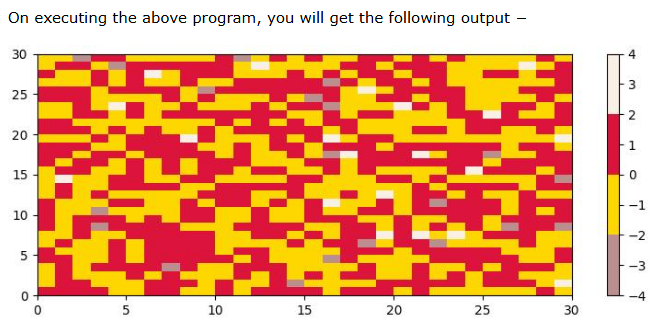
from matplotlib.colors import LinearSegmentedColormap

colors = ["rosybrown", "gold", "lawngreen", "linen"]
cmap_from_list = [LinearSegmentedColormap.from_list("SmoothCmap", colors)]

# Plotting example
np.random.seed(19680801)
data = np.random.randn(30, 30)
fig, axs = plt.subplots(1, 1, figsize=(7, 3), layout='constrained')
psm = axs.pcolormesh(data, cmap=cmap_from_list[0], rasterized=True, vmin=-4, vmax=4)
fig.colorbar(psm, ax=axs)
plt.show()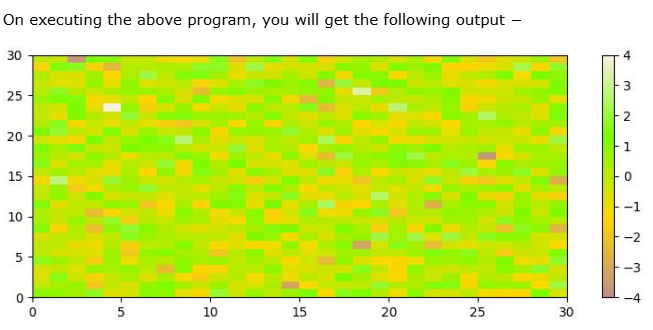
from matplotlib.colors import ListedColormap

colors = ["#bbffcc", "#a1fab4", "#41b6c4", "#2c7fb8", "#25abf4"]
my_cmap = ListedColormap(colors, name="my_cmap")
my_cmap_r = my_cmap.reversed()

# Plot both
def plot_examples(colormaps):
   np.random.seed(19680801)
   data = np.random.randn(30, 30)
   fig, axs = plt.subplots(1, len(colormaps), figsize=(10, 3), layout='constrained')
   for [ax, cmap] in zip(axs.flat, colormaps):
      psm = ax.pcolormesh(data, cmap=cmap, rasterized=True, vmin=-4, vmax=4)
      fig.colorbar(psm, ax=ax)
   plt.show()

plot_examples([my_cmap, my_cmap_r])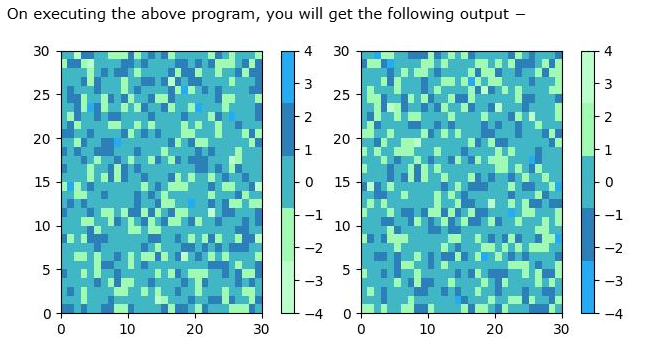
import matplotlib as mpl

mpl.rc('image', cmap='RdYlBu_r')

fig, (ax1, ax2) = plt.subplots(1, 2, figsize=(7, 4))
data = np.random.rand(4, 4)

ax1.imshow(data)
ax1.set_title("Default colormap")

ax2.imshow(data)
ax2.set_title("Modified default colormap")
plt.show()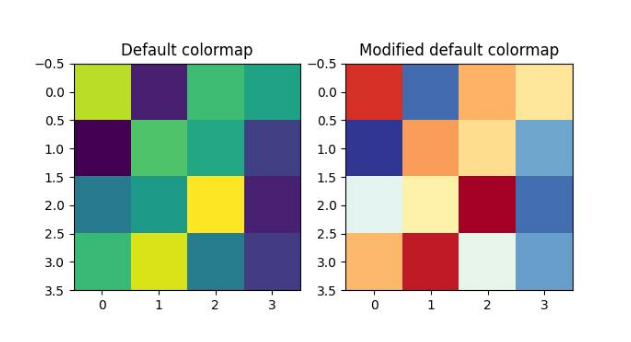
import numpy as np
import matplotlib.pyplot as plt

plt.rcParams["figure.figsize"] = [7.00, 3.50]
plt.rcParams["figure.autolayout"] = True

x = np.linspace(0, 2 * np.pi, 64)
y = np.exp(x)
plt.plot(x, y)

n = 20
colors = plt.cm.rainbow(np.linspace(0, 1, n))
for i in range(n):
   plt.plot(x, i * y, color=colors[i])

plt.xlim(4, 6)
plt.show()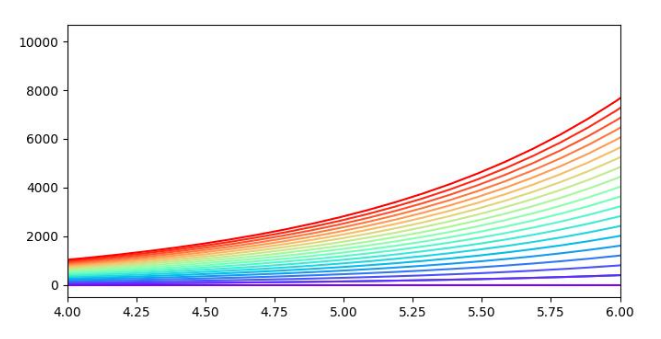
All content © Vista Academy – Elevate your Python visualization skills today!