
Text properties in Matplotlib allow customization of the appearance and layout of text elements in plots, offering control over font style, color, size, alignment, transparency, and more.
import matplotlib.pyplot as plt

fig, ax = plt.subplots(figsize=(7, 4))
plt.axis((0, 10, 0, 10))

ax.text(5, 7, 'Centered Text with 0 rotation', horizontalalignment='center', verticalalignment='center', rotation=0)
ax.text(1, 5, 'Right Aligned Text with 90 degrees rotation', ha='right', va='center', rotation=90)
ax.text(9, 5, 'Left Aligned Text with -90 degrees rotation', ha='left', va='center', rotation=-90)
ax.text(5, 2, 'Multiline\nText', ha='center', va='center', multialignment='center')

plt.show()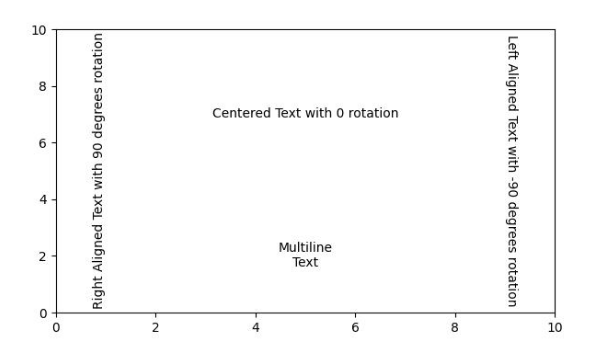
import matplotlib.pyplot as plt

fig, ax = plt.subplots(figsize=(7, 4))
plt.axis((0, 10, 0, 10))

ax.text(3, 8, 'Plain text without any property')
ax.text(3, 6, 'Colored Text', color='blue')
ax.text(3, 4, 'Background Color', backgroundcolor='yellow')
ax.text(3, 2, 'Transparent Text', alpha=0.5)

plt.show()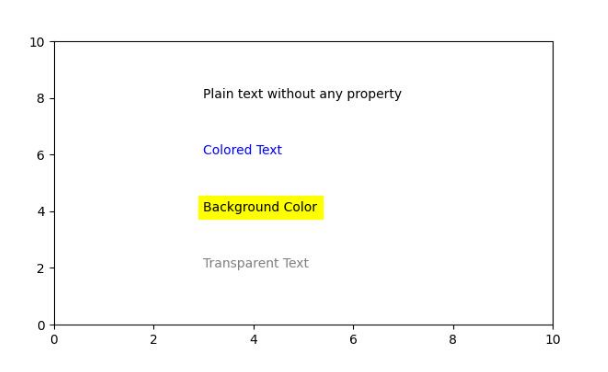
import matplotlib.pyplot as plt

fig = plt.figure(figsize=(7, 4))
plt.axis((0, 10, 0, 10))

sample_text = ("Vista Academy")

plt.text(0, 9, 'Oblique text placed at the center with a 25-degree rotation',
   fontstyle='oblique', fontweight='heavy', ha='center', va='baseline', rotation=45, wrap=True)
plt.text(7.5, 0.5, 'Text placed at the left with a 45-degree rotation', ha='left', rotation=45, wrap=True)
plt.text(5, 5, sample_text + '\nMiddle', ha='center', va='center', color='green', fontsize=24)
plt.text(10.5, 7, 'Text placed at the right with a -45-degree rotation', ha='right', rotation=-45, wrap=True)
plt.text(5, 10, 'Sans text with oblique style is placed at the center', fontsize=10, fontname='Sans',
   style='oblique', ha='center', va='baseline', wrap=True)
plt.text(6, 3, 'A serif family text is placed right with the italic style', family='serif',
   style='italic', ha='right', wrap=True)
plt.text(-0.5, 0, 'Small-caps variant text is placed at the left with a -25-degree rotation',
   variant='small-caps', ha='left', rotation=-25, wrap=True)

plt.show()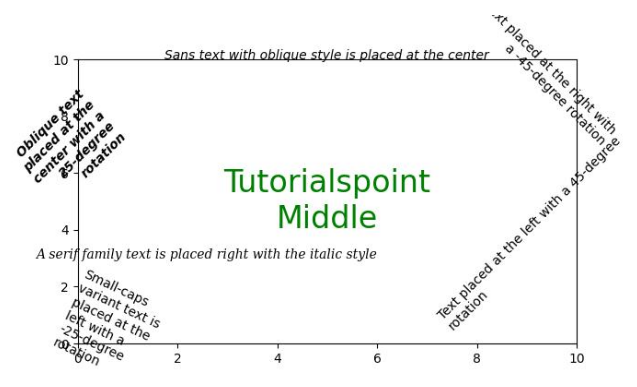
import matplotlib.pyplot as plt

fig = plt.figure(figsize=(7, 4))
plt.axis((0, 10, 0, 10))

plt.text(3, 7, 'Text with Bounding Box', bbox={'facecolor': 'yellow', 'edgecolor': 'blue', 'pad': 5})
plt.text(3, 5, 'Clipped Text', bbox={'facecolor': 'lightgreen', 'edgecolor': 'darkgreen', 'pad': 5}, clip_on=True)

plt.show()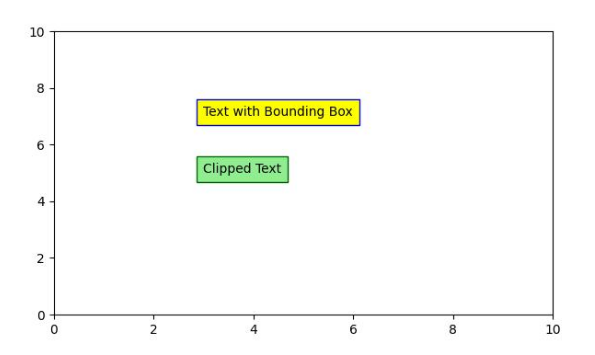
With these powerful text properties, you can precisely control how text appears and behaves in your plots for improved readability and aesthetics. Learn more only at Vista Academy.