
Matplotlib library is highly compatible with various operating systems and Python environments. Setting up Matplotlib is relatively straightforward and its versatility makes it a valuable tool for visualizing data in Python. It involves ensuring that it is installed and configuring its behavior within our Python environment.
Matplotlib is often included in Python distributions like Anaconda. However, if it’s not installed, use the following command:
pip install matplotlibTo verify the installation:
import matplotlib.pyplot as pltIf no errors occur, the installation is successful.
%matplotlib inline
# or
%matplotlib notebookimport matplotlib
matplotlib.use('Agg')Create a configuration file named matplotlibrc to customize behavior.
import matplotlib
matplotlib.matplotlib_fname()
Edit this file to set default figure size, line styles, fonts, etc.
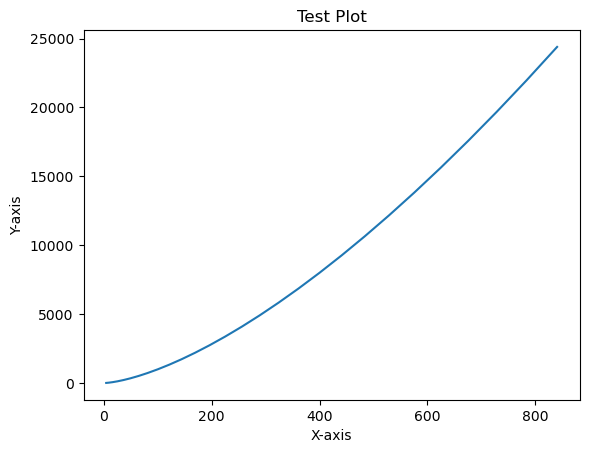
import matplotlib.pyplot as plt
x = [i**2 for i in range(2,30)]
y = [i**3 for i in range(2,30)]
plt.plot(x, y)
plt.xlabel('X-axis')
plt.ylabel('Y-axis')
plt.title('Test Plot')
plt.show()
Output: Test Plot
If Python 2.7 or 3.4 is not installed for all users, install:
For Mac with Python 2.7, execute:
xcode-select --installThis may compile subprocess32, a dependency.
For old Linux + Python 2.7, you may need the master version of subprocess32.