Understanding Chi-Square Distribution: A Guide to Hypothesis Testing
What is Chi-Square Distribution?
The Chi-Square distribution is a widely used probability distribution in statistics, particularly for hypothesis testing. It’s mainly used for testing the goodness of fit between observed data and the expected distribution. In essence, it helps us understand how far the observed values are from what we would expect under the null hypothesis.
Key Parameters of Chi-Square Distribution
- Degrees of Freedom (df): The number of independent values or quantities that can vary in an analysis.
- Size: The shape of the returned array, specifying how many data points are needed for the sample.
Example: Drawing a Sample from Chi-Square Distribution
Here’s how you can generate a sample from a Chi-Square distribution using Python:
from numpy import random

x = random.chisquare(df=2, size=(2, 3))
print(x)
This code generates a 2×3 matrix of random samples drawn from a Chi-Square distribution with 2 degrees of freedom.
Visualizing Chi-Square Distribution
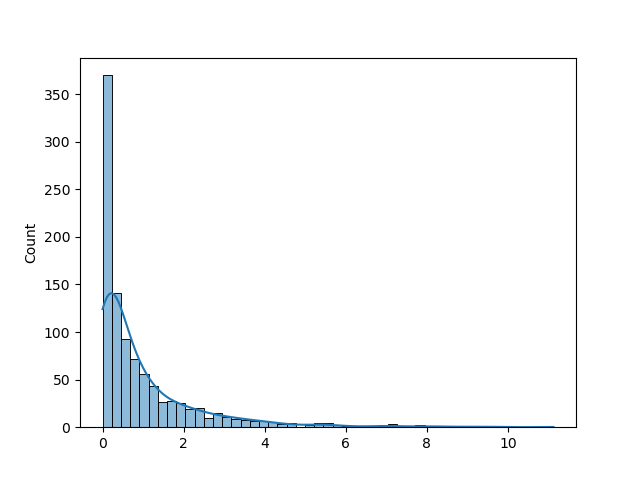
It’s often useful to visualize the distribution to better understand its properties. Below is an example of how you can visualize a Chi-Square distribution with a degree of freedom of 1, using Python:
from numpy import random
import matplotlib.pyplot as plt
import seaborn as sns

sns.distplot(random.chisquare(df=1, size=1000), hist=False)
plt.show()
This generates a smooth curve that shows how the Chi-Square distribution behaves with 1 degree of freedom.
Why is Chi-Square Distribution Important?
The Chi-Square distribution plays a crucial role in hypothesis testing, particularly for testing the goodness of fit and independence. It helps to assess if observed frequencies match expected frequencies, making it essential in various fields like biology, economics, and social sciences.
Conclusion
Understanding the Chi-Square distribution and how to apply it to your data can significantly improve your ability to perform hypothesis testing. With the right tools and methods, you can gain valuable insights into your data and make more informed decisions.